Steam Study

I was hired by a game studio to analyze data from the Steam platform, looking for key information for their next development. I helped them formulate the most relevant questions and draw conclusions.
DISCLAIMER: For data protection reasons and as agreed with my client, the dataset presented here has a cutoff date of MAY 2019, 5 years before the study was conducted. Additionally, some conclusions have been trimmed or changed from the final report delivered. I am available for any questions/clarifications :)
Steam Study Jupyter Notebook
Click here to view the Jupyter notebook and see other steps such as data cleaning and handling. It is commented for easier step-by-step readability.
This analysis aimed to answer the following questions:
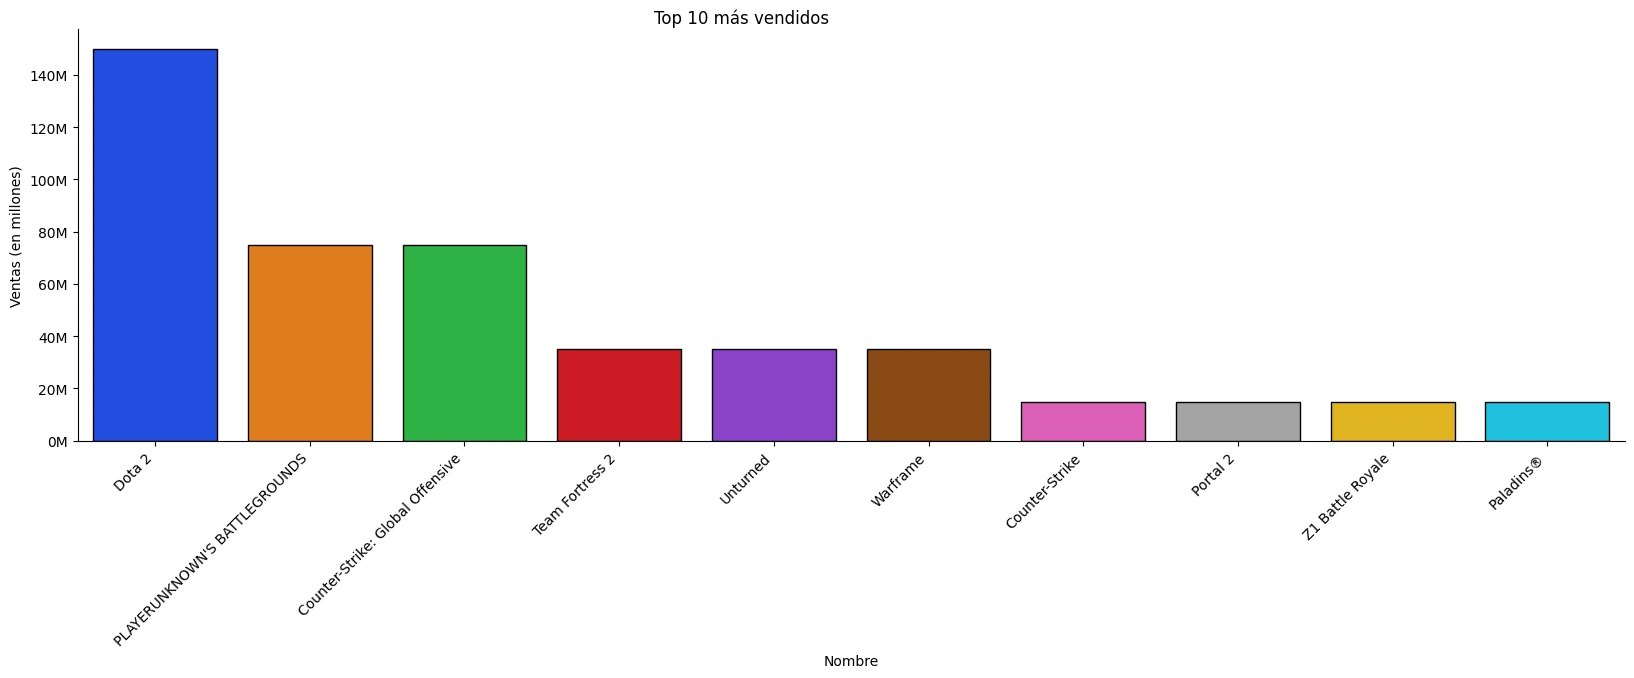
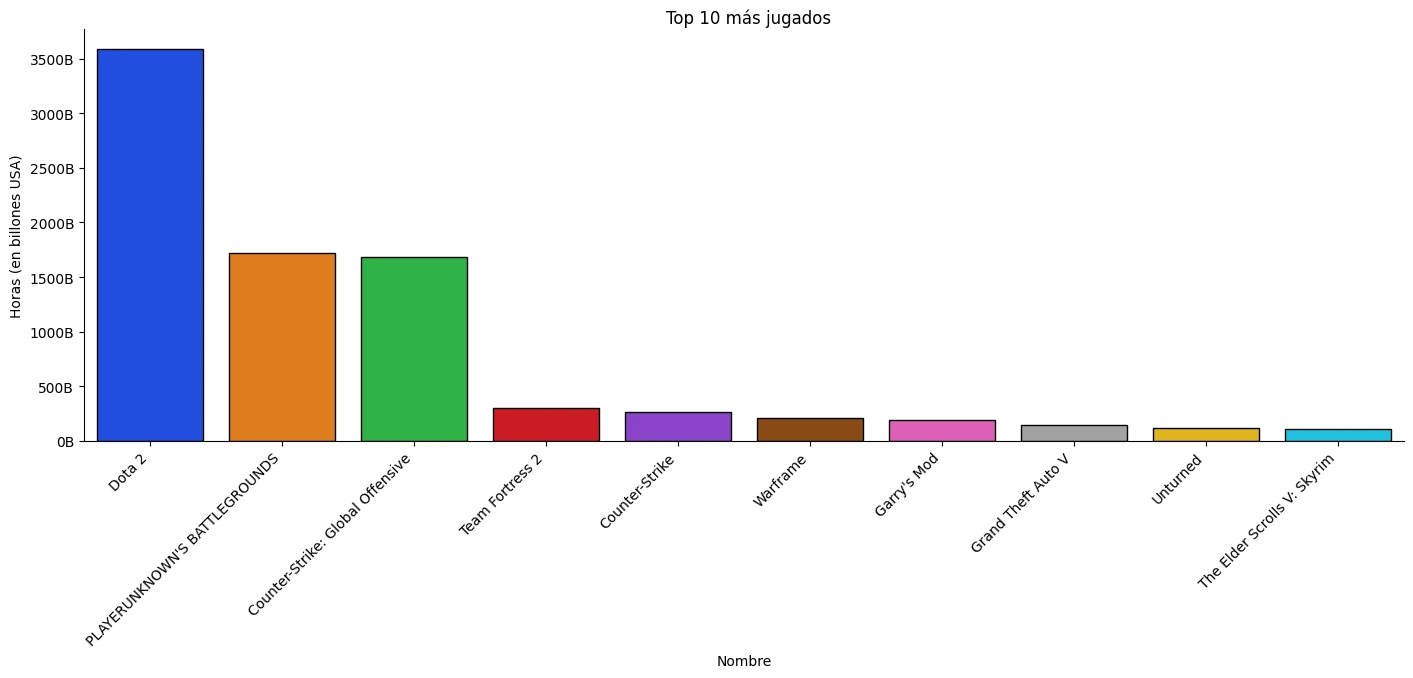
1. What is the TOP10 most played games?
We were able to answer this question from two different angles: by the number of copies sold and by the number of hours played. Important. For Steam, a sale is a download. Although the list has similar titles, with Dota 2 standing out in both cases, having different perspectives is good since there are several free titles on the list. It is natural that free games are the most downloaded, and they are usually games without an ending. That is, games with no time limit or replayability. But we also have non-free games, and it is impressive that games with a beginning and an end compete on these lists. Games like Elder Scrolls are among the most played in terms of hours, yet they are not among the best-selling. This means that with a smaller player base, each player plays many hours. We also have Portal 2, which, being a short game (completed in an average of 8 hours), is one of the best-selling games in history. It speaks to its virality and great success.
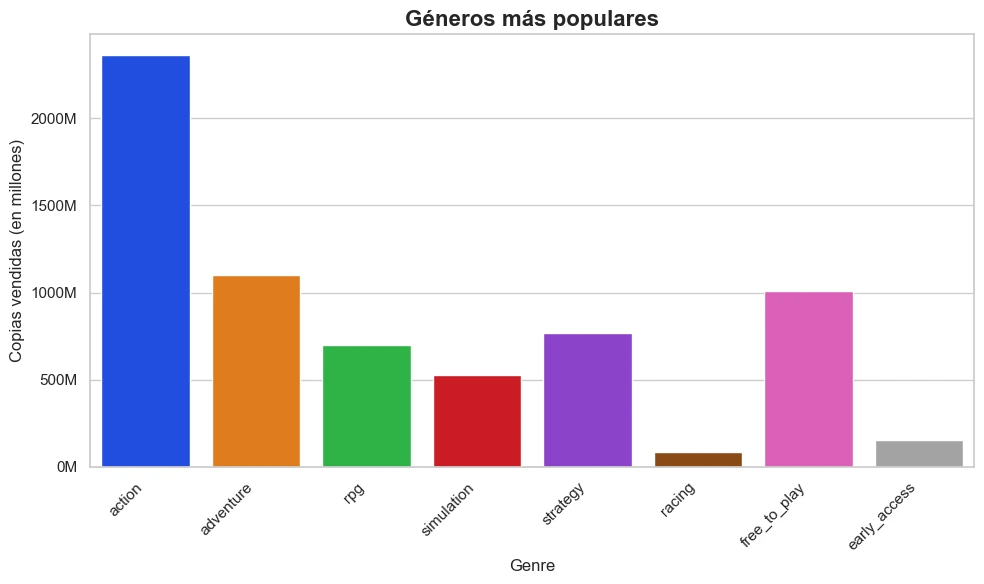
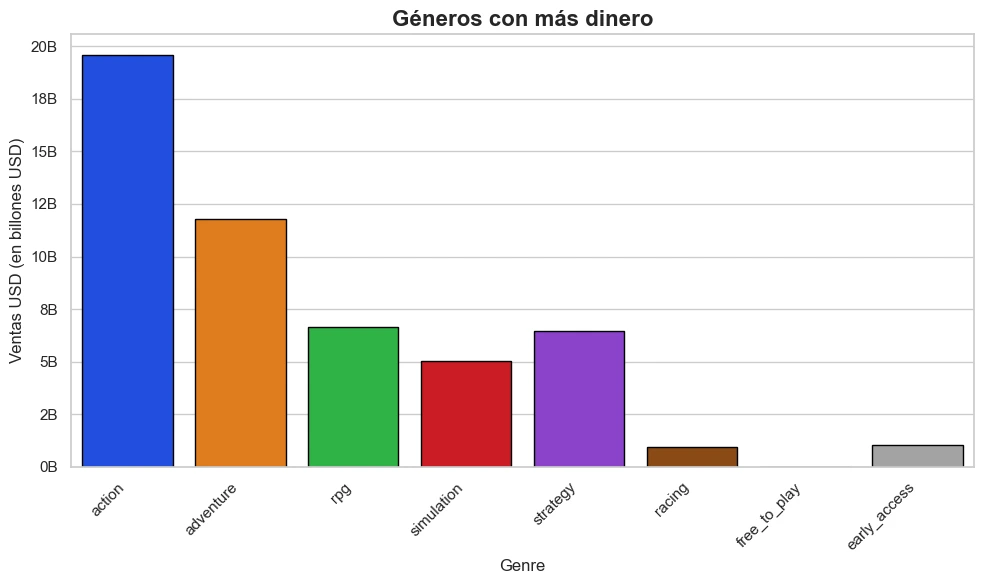
2. What is the best-selling video game genre?
For this question, we can consider two perspectives: the most downloaded genres and the genres that generate the most revenue. It is important to note that a game can belong to more than one genre. This distinction is important because free-to-play games are the third most popular genre but do not have a cost beyond in-game purchases (skins, battle passes, etc.). We observe that the action genre is the undisputed leader in both popularity and sales. We also highlight that there are niche genres that do not occupy the same place in popularity and sales. This is the case for RPGs, which are below strategy in popularity but above in revenue. This tells us that they tend to be more expensive, even with a smaller player base.
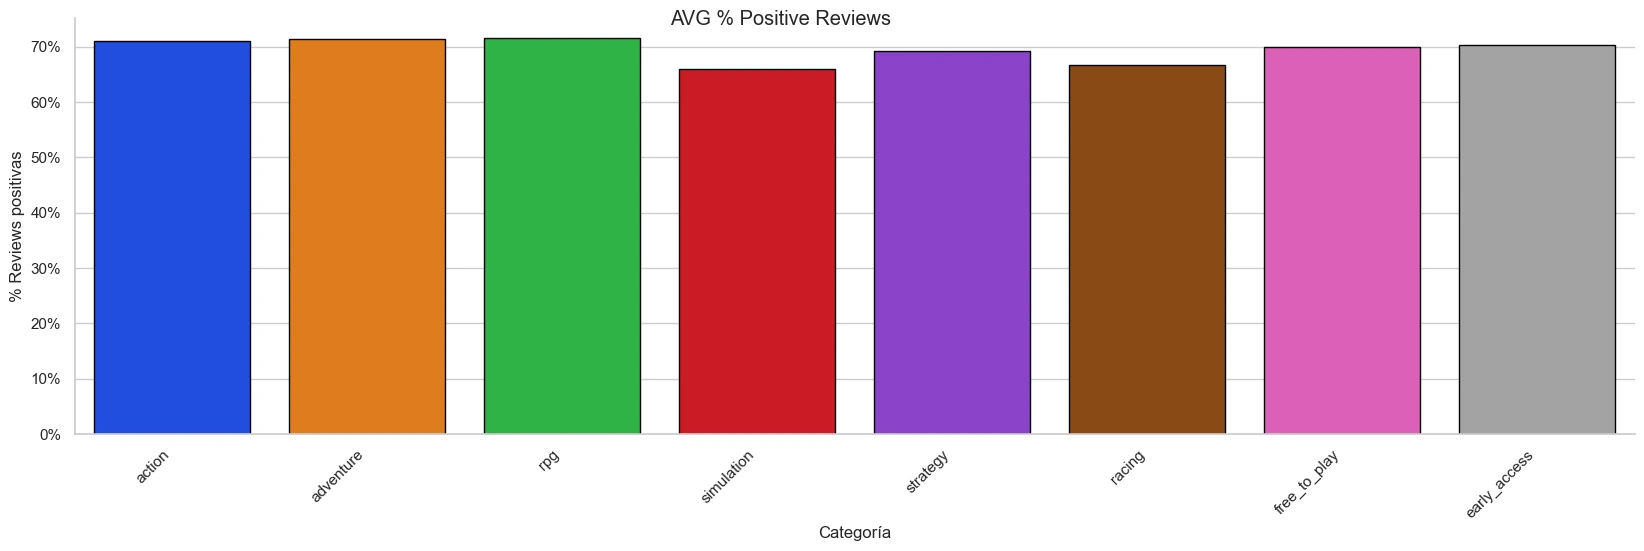
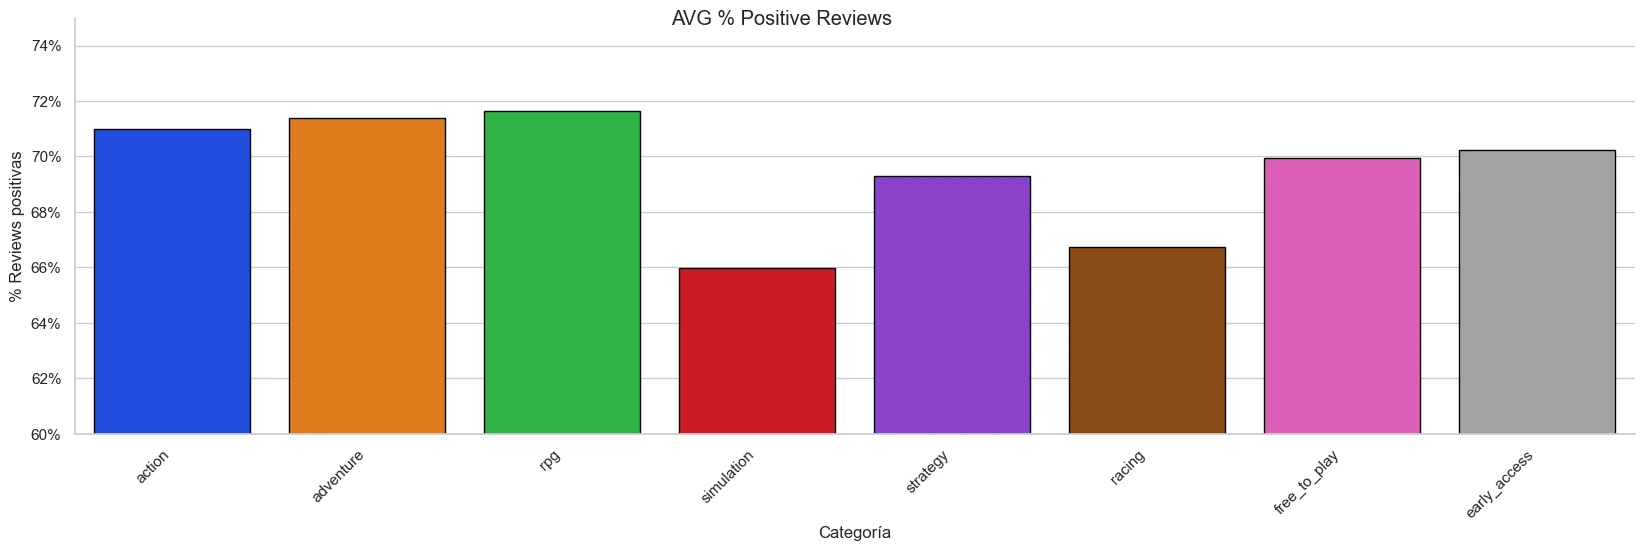
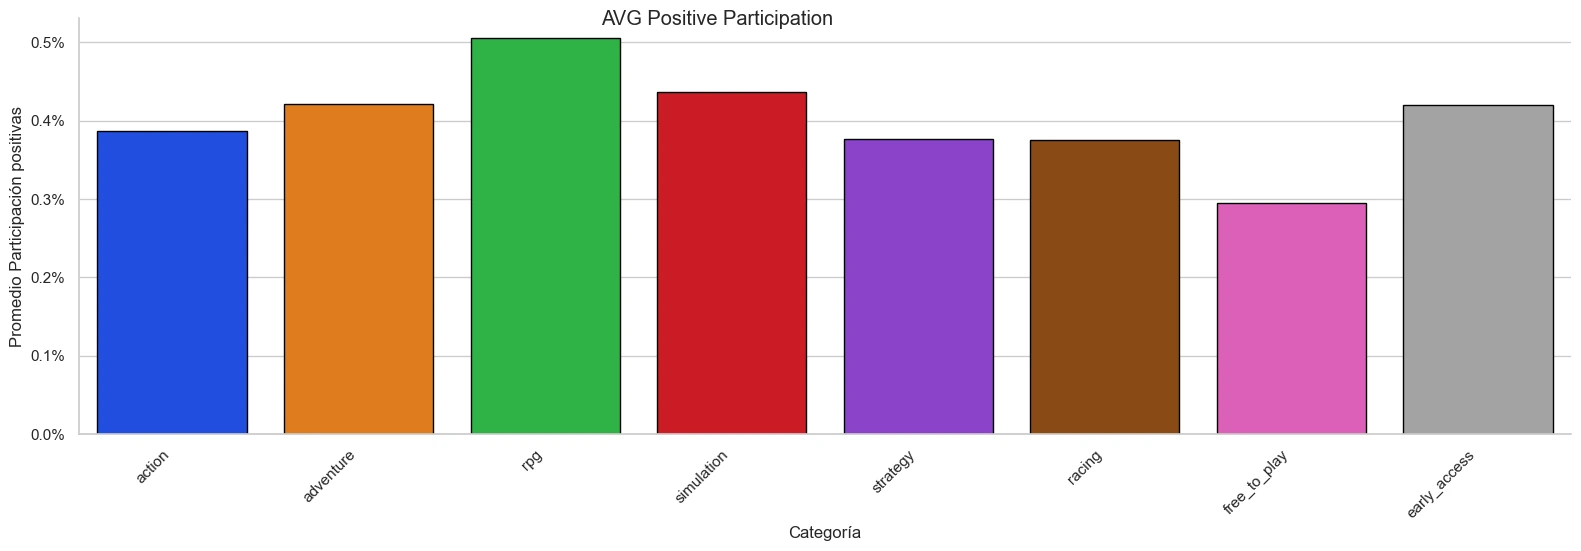
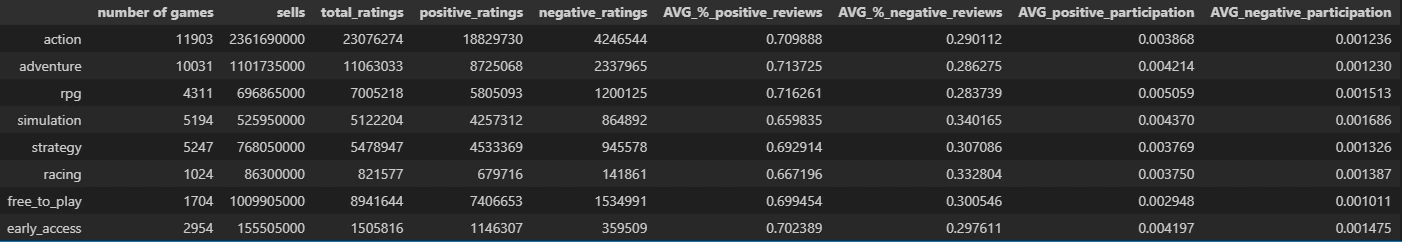
3. Which genres have the best average reviews?
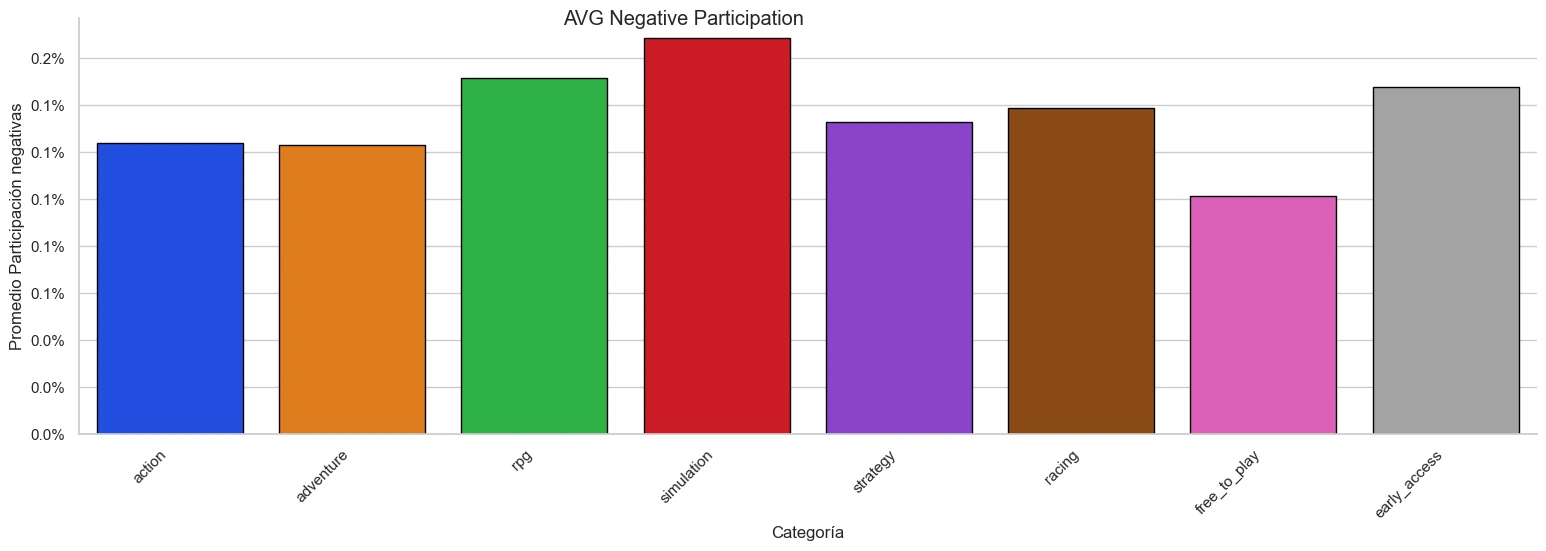
We can observe that all genres have a similar number of positive reviews. Upon closer inspection, we see that the RPG genre is slightly better reviewed than the others. Similarly, the Simulation and Racing genres are slightly worse reviewed. As a complement, I also found it important to study participation in each genre, that is, how many players leave a positive or negative review. Here we see that the RPG genre also has the highest positive participation. We highlight that Free-to-Play games are the ones that receive the fewest reviews in general. Finally, Simulation and RPG games are the ones that receive the most reviews. That is, players express their positive or negative opinions more frequently.
4. How much has the developer with the most game sales earned?
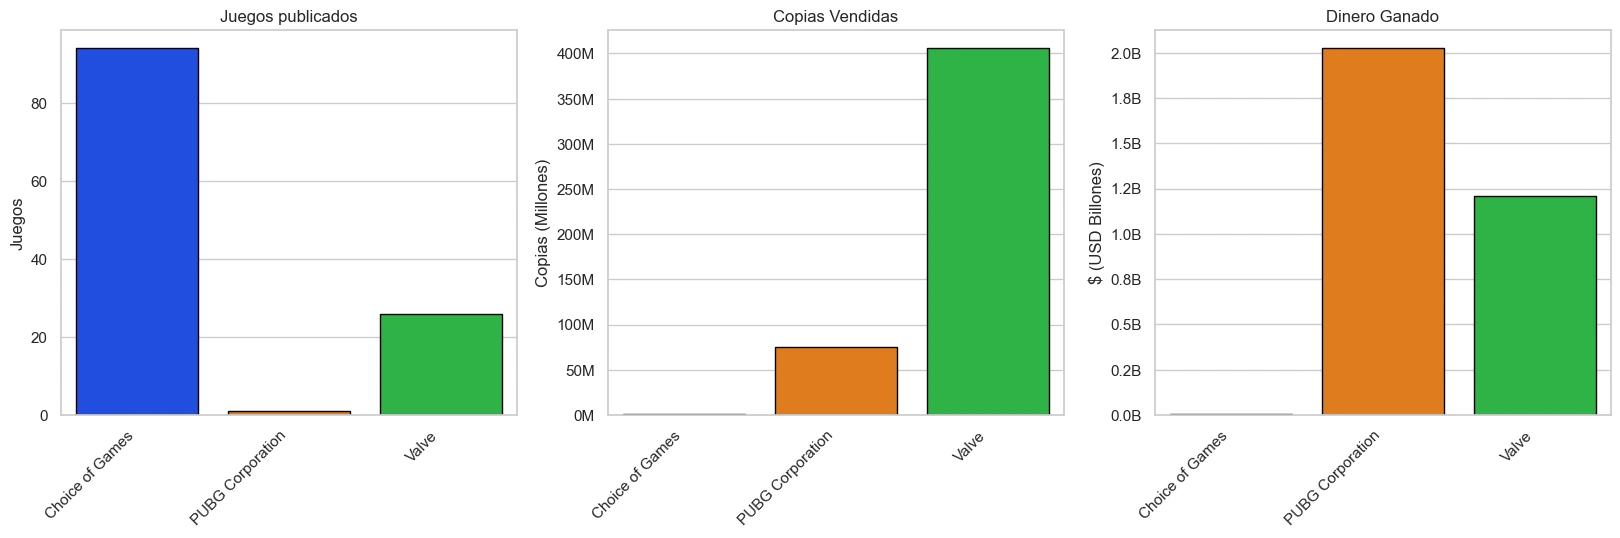
For this question, we can consider the number of copies sold, with Valve having over 400 million copies, representing sales of nearly 1.3 billion USD. Another perspective is how much the developer with the most titles has earned, with Choice of Games earning 4.1 million USD. Additionally, we identified the developer that has earned the most money from selling titles. This is PUBG Corporation with 2 billion USD. It is very interesting that PUBG Corporation has only 1 published title, yet it is the top earner. Meanwhile, Choice of Games, being the developer with the most titles, is nowhere near the sales revenue of Valve or PUBG Corporation. Knowing the development costs would allow us to understand the profitability and the necessary work invested by each of these developers. After a quick investigation, it seems that Choice of Games' titles are simple games, always with the same mechanics. Perhaps the invested work and the number of staff are low, resulting in profitability being divided among fewer people. Finally, it is worth noting that Valve is the developer of Dota 2, the most downloaded game in our dataset. Dota 2 is a free-to-play game, meaning that a large portion of the copies sold by Valve have not generated revenue.
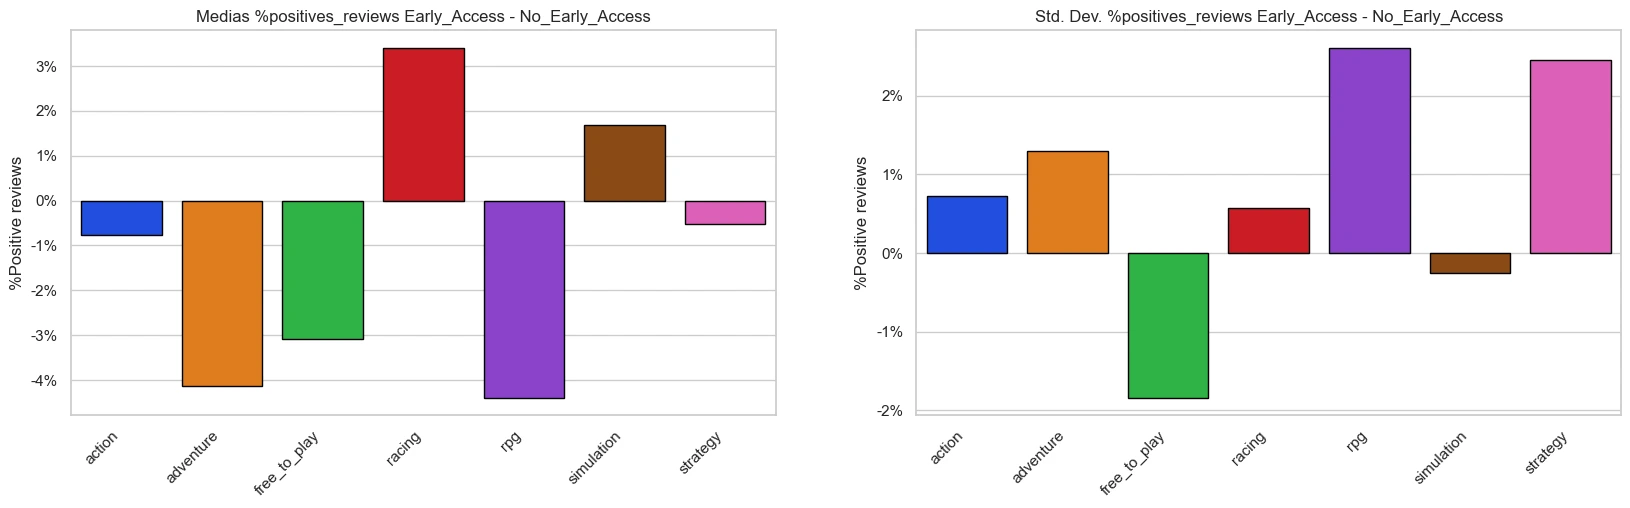
5. How does Early Access affect reviews?
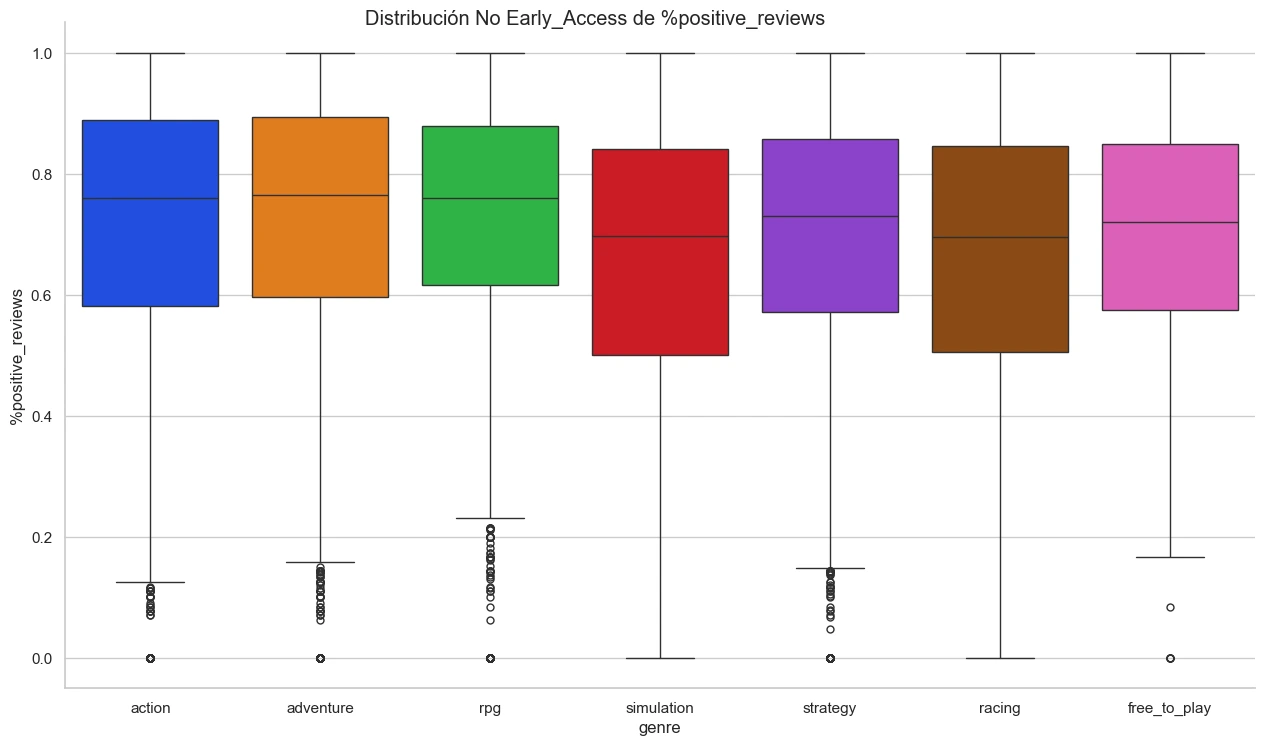
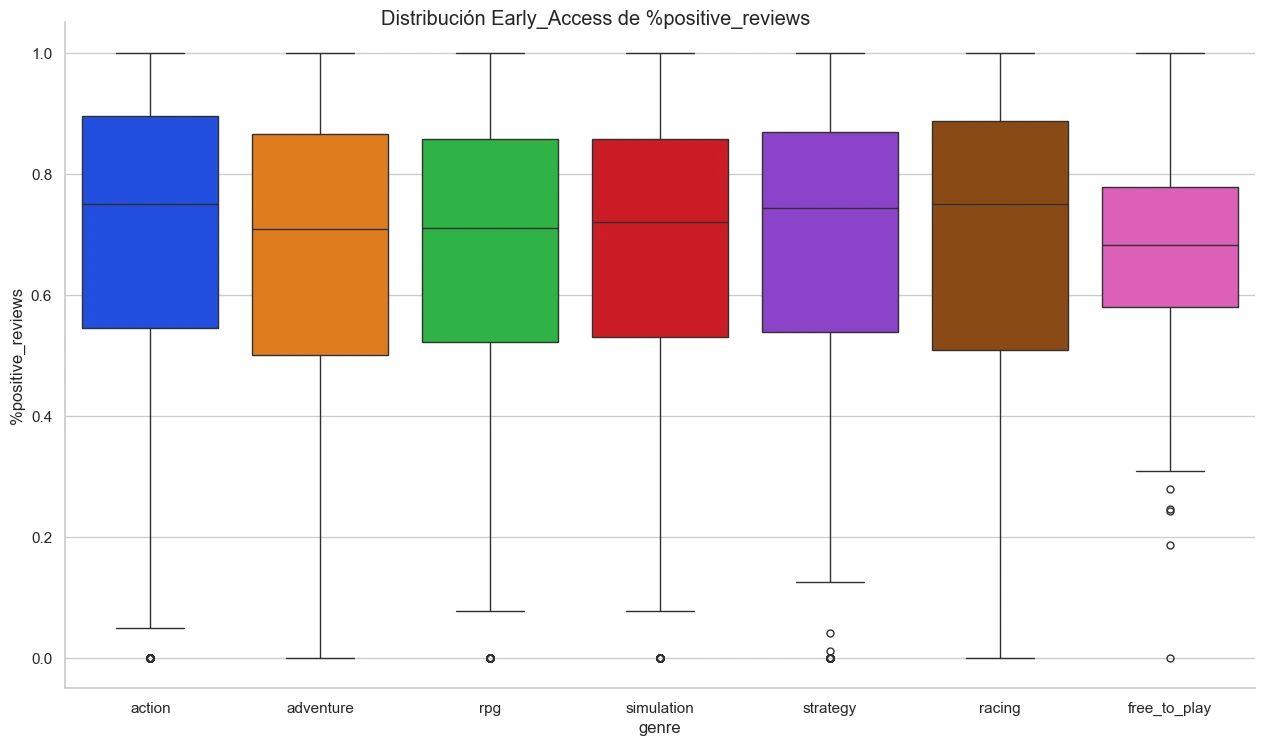
Early Access games have average reviews similar to other genres. Delving deeper, we analyzed the distribution of reviews in this genre. We observed that its boxplot is the widest, meaning that between the 25th and 75th percentiles, the distance is large, indicating significant variance in Early Access game reviews. Remembering that Early Access is just another genre, I found it interesting to analyze the behavior of other genres when they are in Early Access. We highlight the following conclusions: Racing and Simulation are the only genres where Early Access games have better average reviews than non-Early Access games. At the same time, Free-to-Play and Simulation are the only two genres with higher variance in non-Early Access games. That is, lower variance in Early Access games. This suggests that in Free-to-Play games with Early Access, players are more consistent in their ratings compared to those without Early Access. This makes sense since they are free games, with many more players who can try them without spending money.
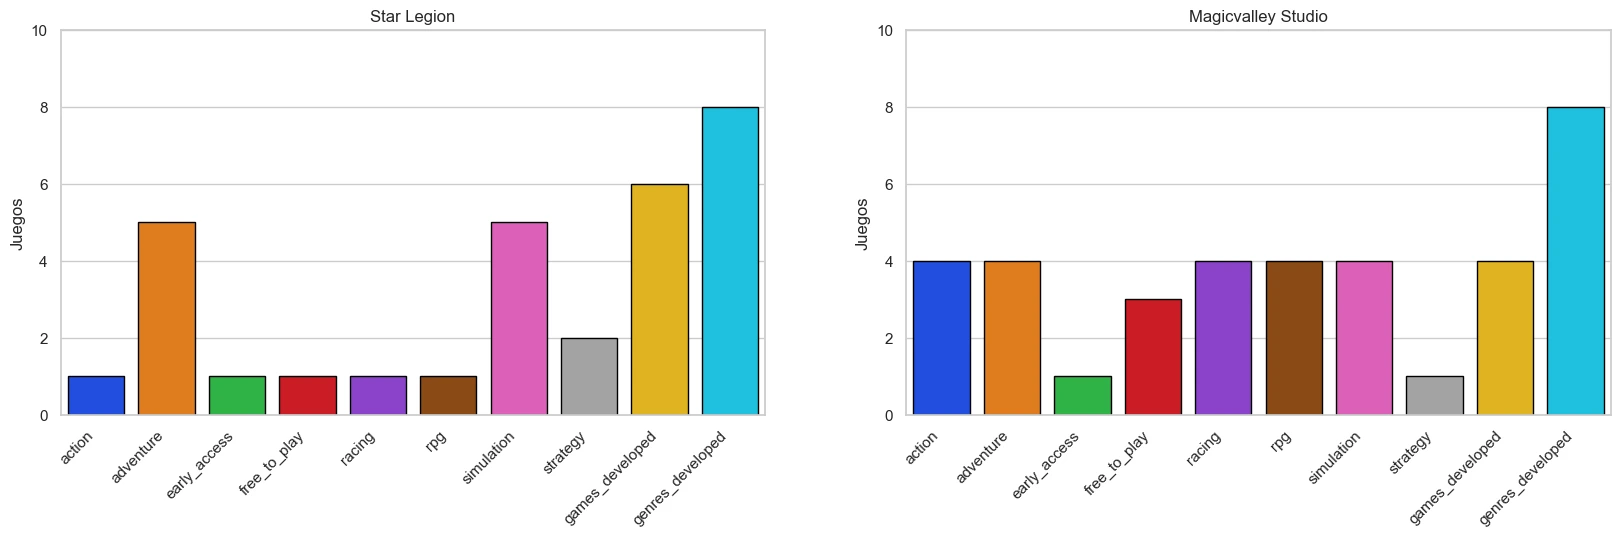
6. Which developer (or developers) has developed the most types and quantity of games?
The two developers that have worked on the most genres are Star Legion and Magicvalley Studio. Both have games in all 8 available genres. Star Legion has developed 6 games, with 5 of them in the adventure genre. Magicvalley has developed 4 games, all with the genres action, adventure, racing, RPG, and simulation. Something interesting is how these developers are nowhere near the developer with the most games. In fact, it could be said that they have developed few games, yet they have decided to categorize their games with almost all, or all, genres. To answer this question, it was important to consider that games can belong to more than one genre. This is why counting the number of games developed does not equate to the number of games in a developer's genres. After a quick internet search, we can see that Star Legion was an indie game developer with generally few players. Meanwhile, Magicvalley's games are virtual reality titles with a small player base as well.
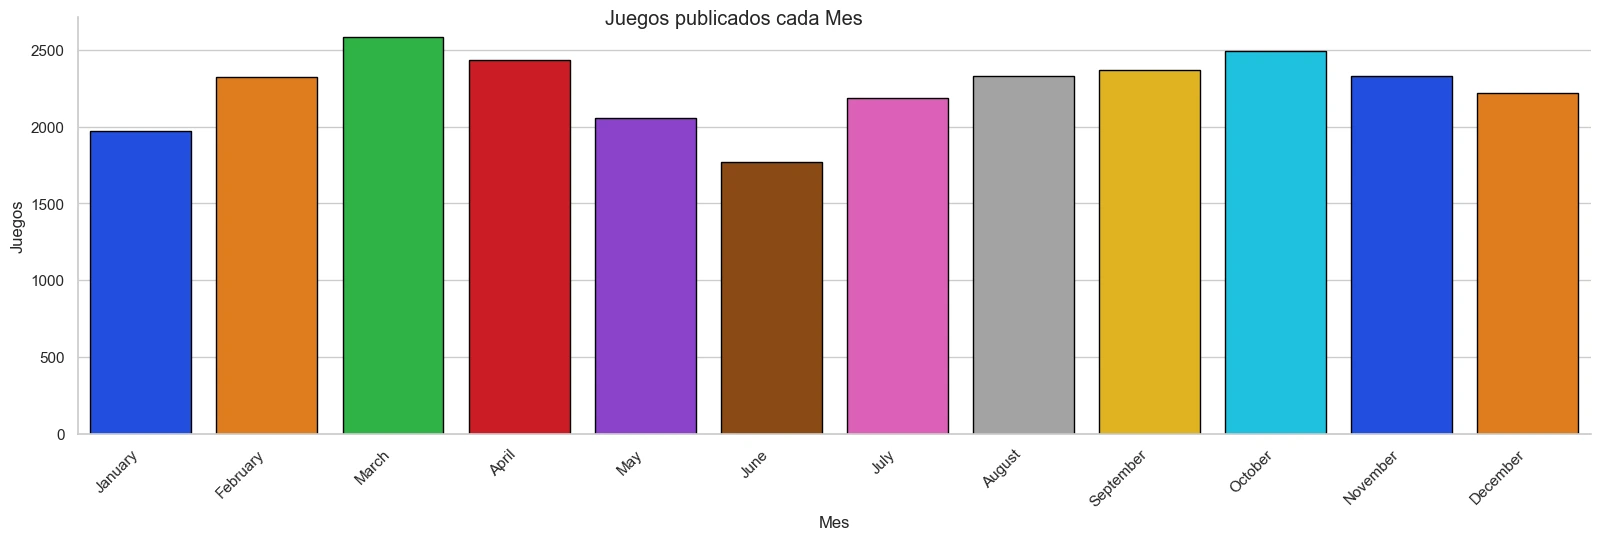
7. In which month, since we have data, have the most games been published?
Grouping releases by month, we can see that March is the month with the most games published. It is interesting to note the apparent seasonality in releases. It seems to increase at the beginning of the year until March and then decrease until reaching the lowest point, only to rise again until October. A time series analysis could help us more easily see if there is seasonality. Finally, grouping by month and year, we notice that the month with the most publications was March 2018, and the top 4 spots belong to the year 2018. This might suggest an increasing trend in the number of games published per year.
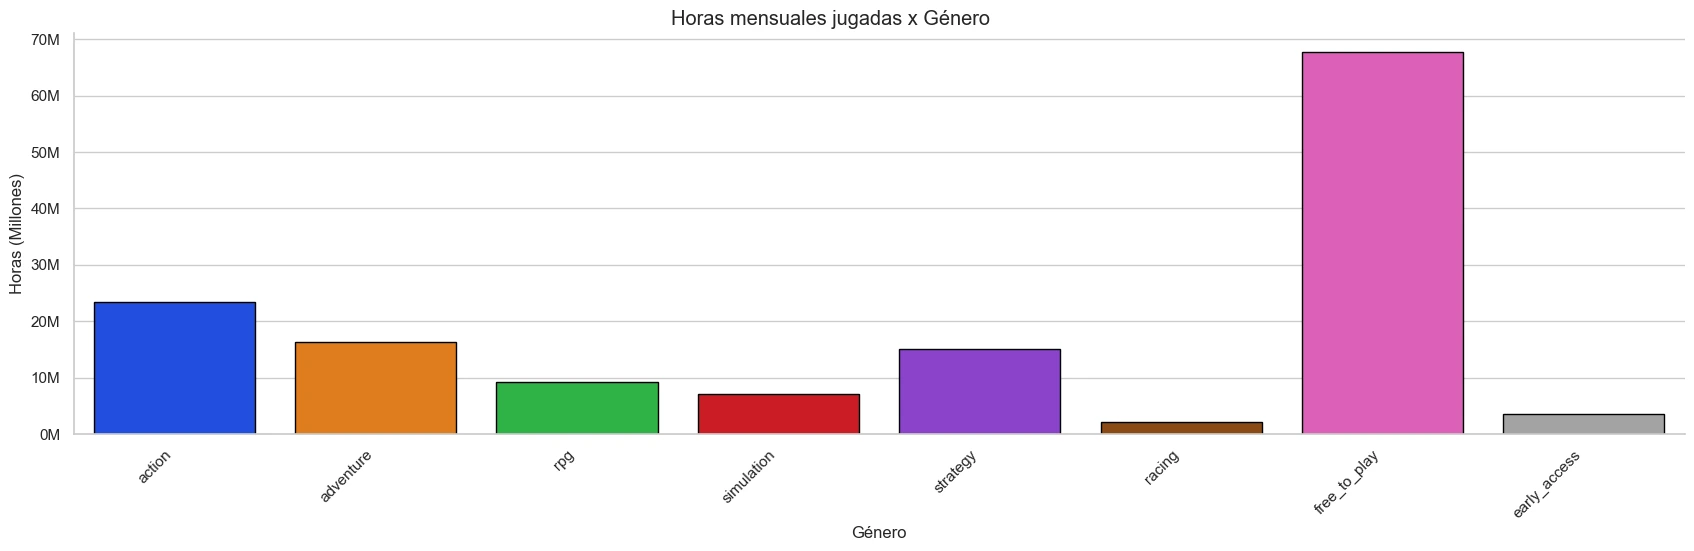
8. How many hours are played on average per game type monthly?
To answer this question, I considered the total hours played, calculated from the number of sales * the average hours played per player, for each game. Then, I calculated the months the game has been available from its release until our last month in the data (May 2019). I assumed that the hours played have been evenly distributed across the published months. This distribution is most likely incorrect, but we have no other way to gauge popularity while considering the game's age. Finally, I grouped the data by genre and calculated the average for each. The result shows that Free-to-Play games record the most hours per month. This could be explained by them being free. It could also be explained by the replayability these games offer, as they lack a story and include titles like Dota 2.
9. Do Free-to-Play games have better or worse reviews?
Free-to-Play games have reviews similar to those of other genres.
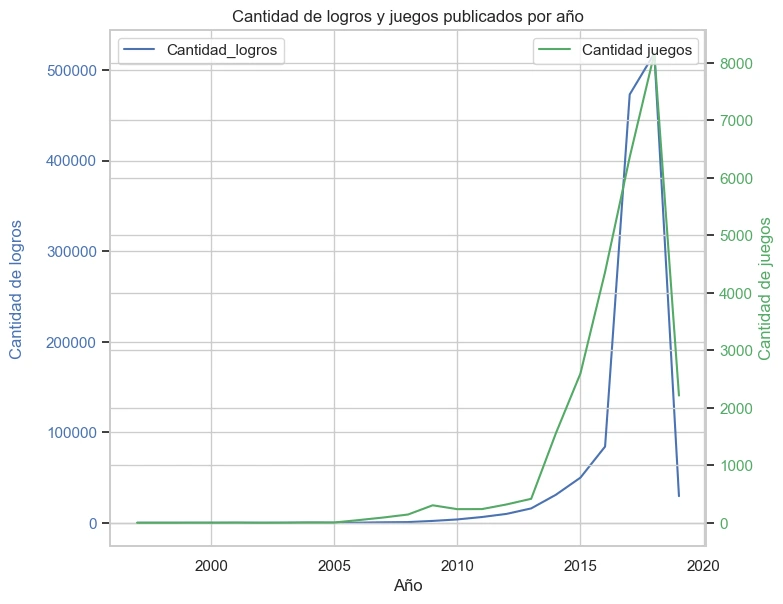
10. How has the number of achievements (trophies) per game evolved?
I calculated the sum of achievements published per year and the number of games published each year. As seen in the graph, the number of games published had always been greater than the number of achievements, meaning there were fewer achievements per game. Starting in 2017, the number of achievements surpassed the number of games, meaning each game would have at least one achievement if distributed evenly. The trend seems to indicate that the number of achievements will continue to grow, but it is unclear if it will continue to exceed the number of games published.